

New Care.com Report Reveals Soaring Childcare Costs Are Crippling Majority of American Families
– Both Single and Married Working Parents Spend on Average in Excess of 20% of Household Income on Childcare –
This press release features multimedia. View the full release here: https://www.businesswire.com/news/home/20230613495283/en/
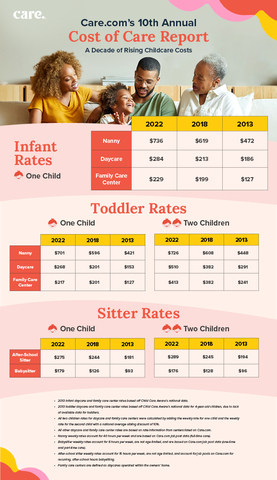
A decade of rising childcare costs from
The report comprises survey results of 3,000 parents and a decade of childcare cost data. It reveals an imploding post-pandemic childcare landscape for
“America’s childcare crisis is just that: a crisis for the entire country and it impacts us all, whether you have children or not,” said
Natalie Mayslich, President, Consumer for
Highlights from the 2023 Cost of Care Report:
A Decade of Rising Weekly Costs*:
-
Nanny:
$736 (up 56% from$472 in 2013) -
Daycare:
$284 (up 53% from$186 in 2013) -
Family Care Center :$229 (up 80% from$127 in 2013) -
Babysitter:
$179 (up 92% from$93 in 2013)
* infant rates except for babysitter, which is not age limited. Rates for toddlers, after school sitters, as well as multiple children, can be found within the report.
Childcare Costs Continue to Soar:
-
● Parents are spending increasingly more of their earnings on childcare:
- 67% spend 20% or more of their annual HHI on childcare (up from 51% in 2022).
- 89% spend 10% or more of their annual HHI on childcare (up from 72% in 2022).
-
● On average, families spend 27% of their HHI on childcare with the majority of parents (59%) planning to spend more than
$18,000 on childcare this year.-
With a national family median household income of
$91K , childcare costs for the typical American family are even more staggering:-
45% of families earning less than
$100K annually will spend more than$18,000 on childcare in 2023, amounting to 18% of their HHI; -
43% of families earning less than
$75K will spend more than$18,000 , amounting to 24% of their HHI; and -
39% of families earning less than
$50K per year will spend more than$18,000 , amounting to a whopping 36% of their HHI.
-
45% of families earning less than
-
With a national family median household income of
The Daycare Dilemma:
- Three in four parents (75%) estimate that there are fewer than half a dozen daycare centers within a 20-minute drive of their home. Additionally, 64% have been waitlisted for daycare with nearly half (49%) waiting longer than three months to get a spot.
-
Beyond the inconvenience, waiting proves costly with 68% spending an additional
$200 or more on care each week (or$2 ,400+) throughout the duration of the wait.
Childcare Villages Are Changing:
- Parents now rely equally on daycare centers and nannies (each 30%), as compared to last year when daycares were used more frequently (31% vs. 22%). The shift reflects the changing nature of work for parents who now need more flexibility.
-
In fact, 45% use childcare in sporadic, nontraditional hours, such as
10am to 1pm . The desire for flexible care solutions is further reflected by the fact that, if both cost and availability were no object, parents would choose a nanny (37%) over daycare (35%).
Childcare’s Impact on Families
|
Family Type |
Work Type |
Top Childcare Arrangement |
Preferred Childcare Arrangement |
Percent (%) Spending More Than |
Avg. Percent (%) of HHI Spent on Childcare |
|
Single Moms |
Hourly |
Daycare (35%) |
Daycare (30%) |
48% |
28% |
|
Salaried |
Daycare (66%) |
Daycare (64%) |
80% |
28% |
|
|
Single Dads |
Hourly |
Paid Family (33%) |
Paid Friends/Nanny (31%) |
49% |
31% |
|
Salaried |
Paid Friends (33%) |
Nanny (29%) |
47% |
23% |
|
|
|
Hourly |
Paid Family (40%) |
Nanny (40%) |
64% |
31% |
|
Salaried |
Daycare (32%) |
Nanny (37%) |
63% |
26% |
|
|
Married Dads |
Hourly |
Paid Friends (35%) |
Nanny (33%) |
59% |
28% |
|
Salaried |
Nanny (36%) |
Daycare (43%) |
61% |
22% |
Top 5 Most Expensive States for Childcare
|
Top 5 most expensive states to hire a nanny: |
Top 5 most expensive states to hire a babysitter: |
Top 5 most expensive states for daycare (infants): |
|||
|
State |
Weekly Rate |
State |
Weekly Rate |
State |
Weekly Rate |
|
|
|
|
|
|
|
|
|
|
|
|
|
|
|
|
|
|
|
|
|
|
|
|
|
|
|
|
|
|
|
|
|
|
|
Along with the report,
The full results of the 2023 Cost of Care Report can be found here and access to graphics displaying the data can be made available upon request.
2023 Cost of Care Report Methodology
This sample of 3,000
Weekly rates for nanny, babysitter and after-school sitter are based on 2022 advertised rates on
About
Available in more than 17 countries,
View source version on businesswire.com: https://www.businesswire.com/news/home/20230613495283/en/
Communications Manager,
natasha.fellion@care.com
Source: